Dask’s dashboard is great, but temporary
Dask has a great set of built-in diagnostic tools. In particular, Dask’s dashboard provides a real-time look into the state of a cluster by displaying the tasks which are current running, the CPU/memory load on the scheduler and workers, scheduler and worker logs, and more. It’s an invaluable tool in helping diagnose the performance of Dask computations.
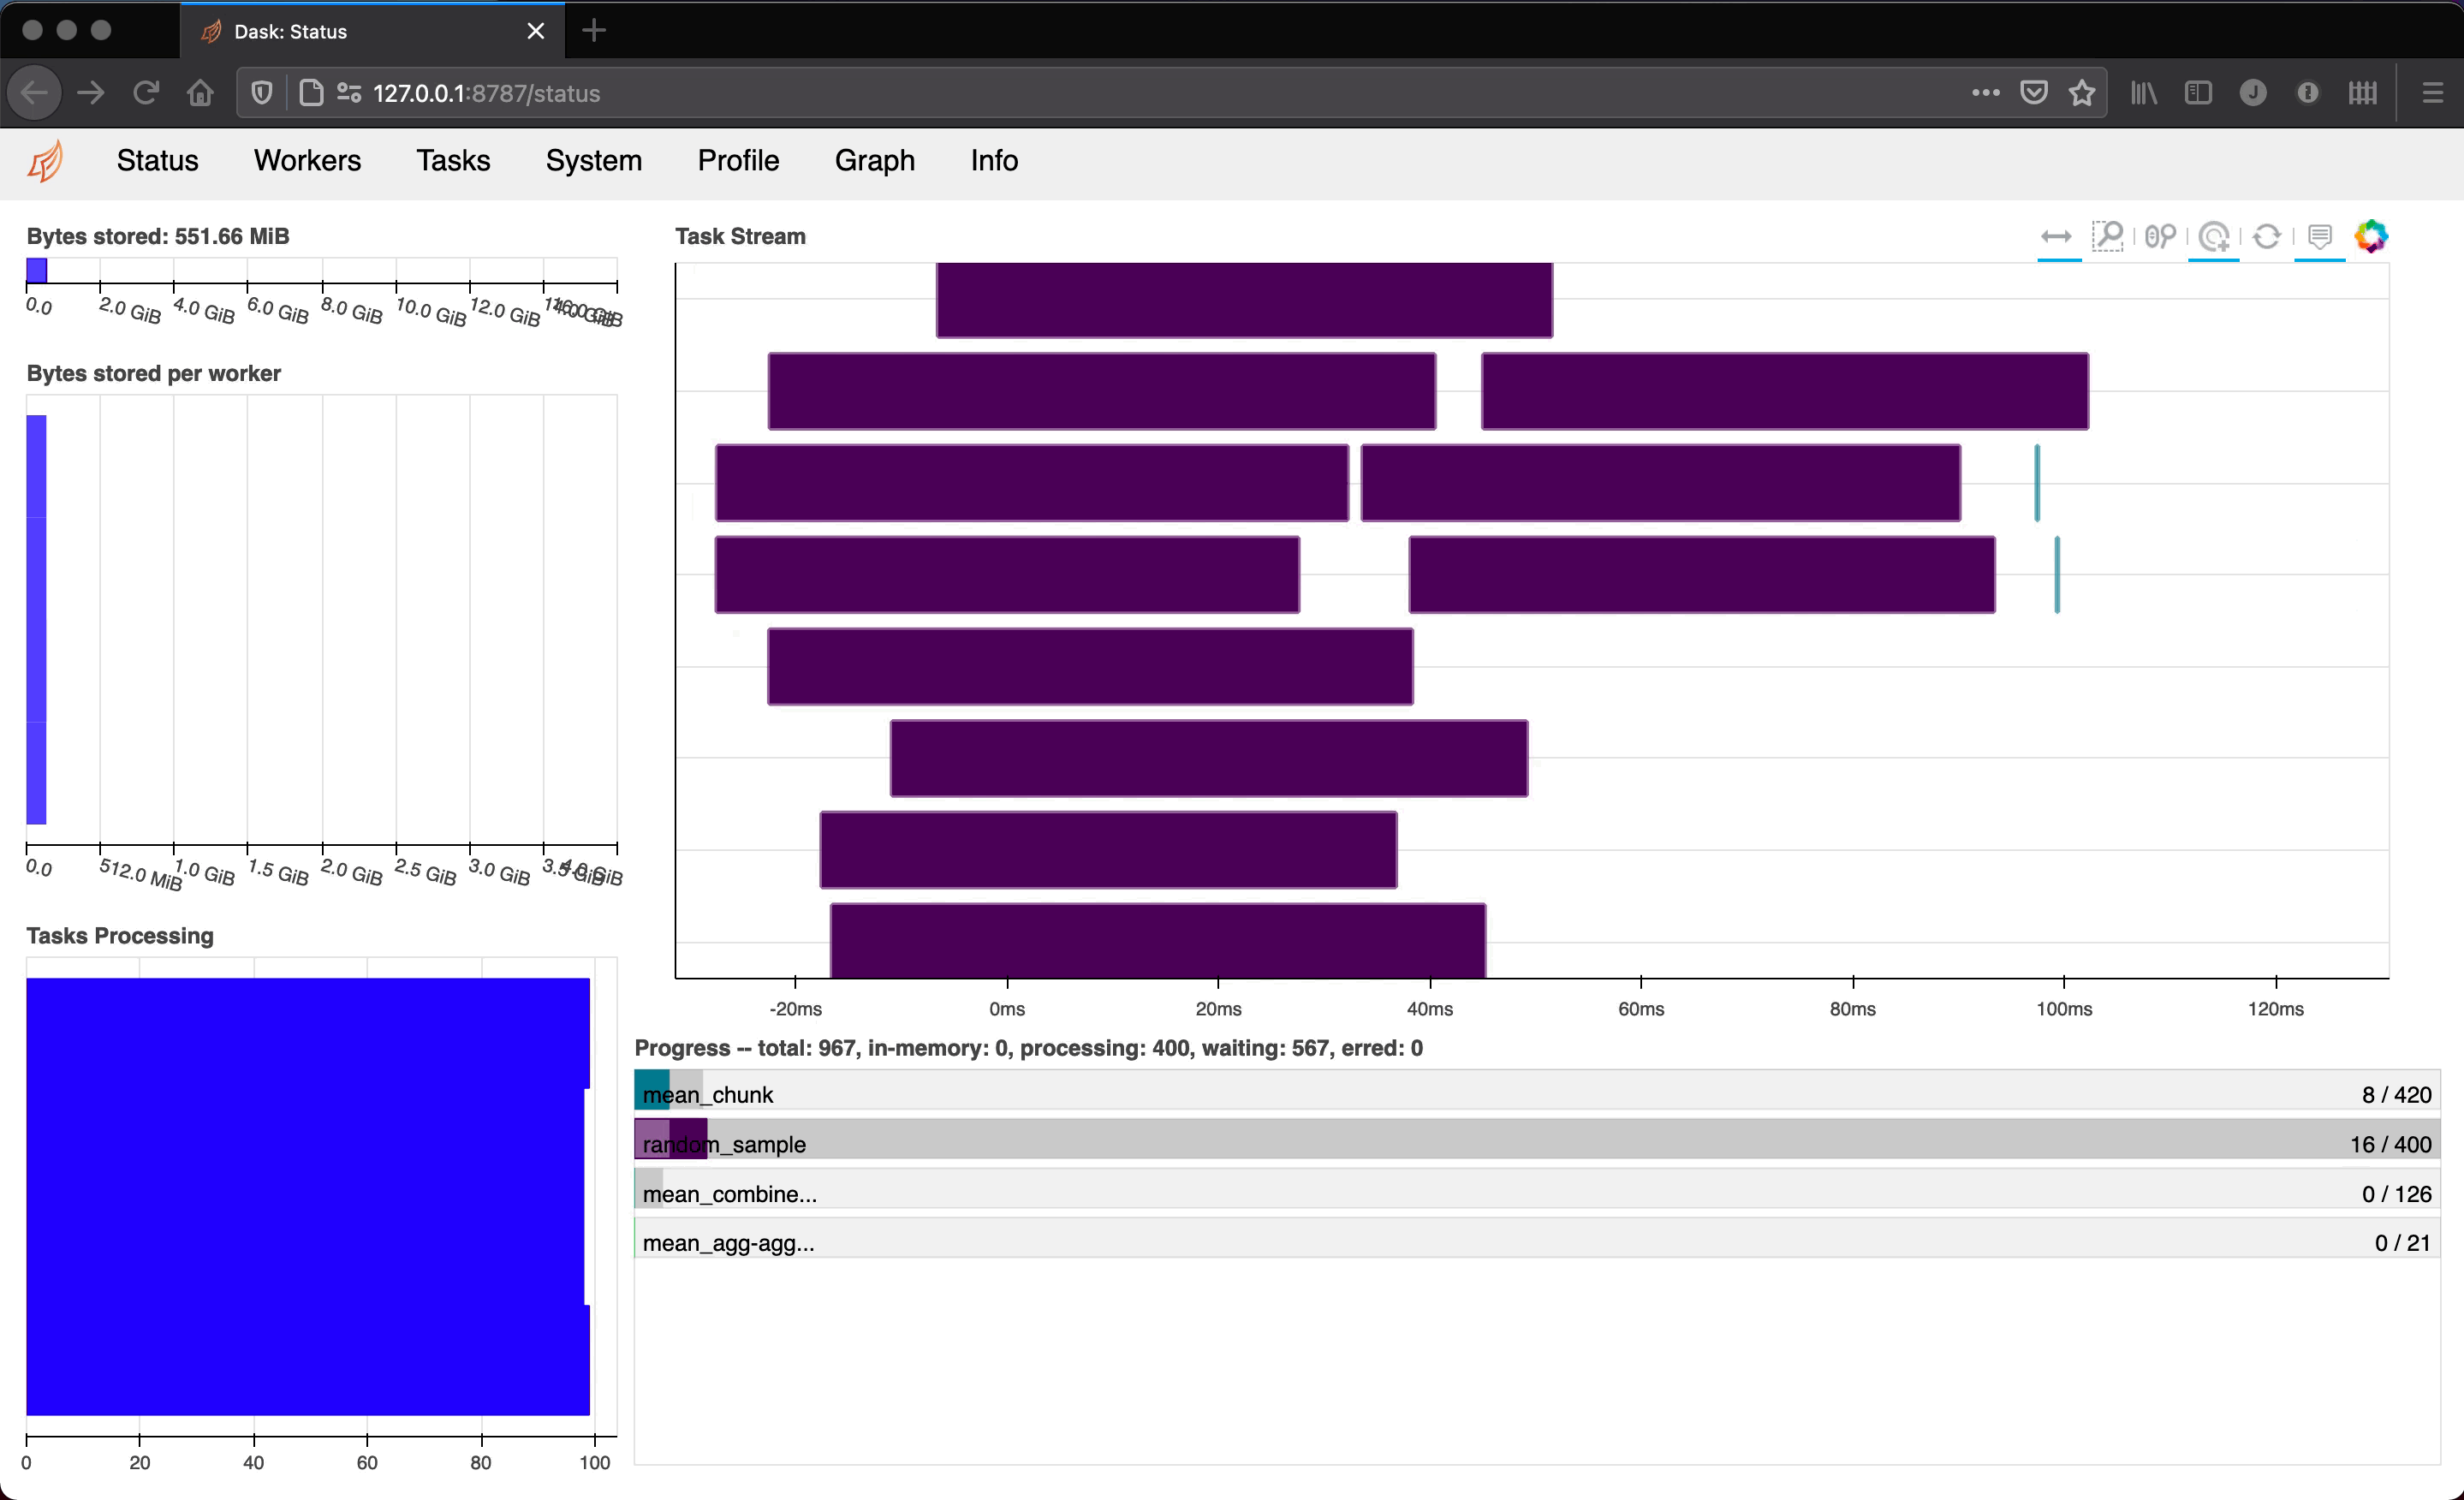
However, part of the real-time nature of the dashboard is that it goes away when the cluster shuts down. This puts Dask users in a situation where they have to take screenshots of their dashboard or, worse yet, try to remember what the task stream plot looked like during a certain part of their computation.
Performance reports can help
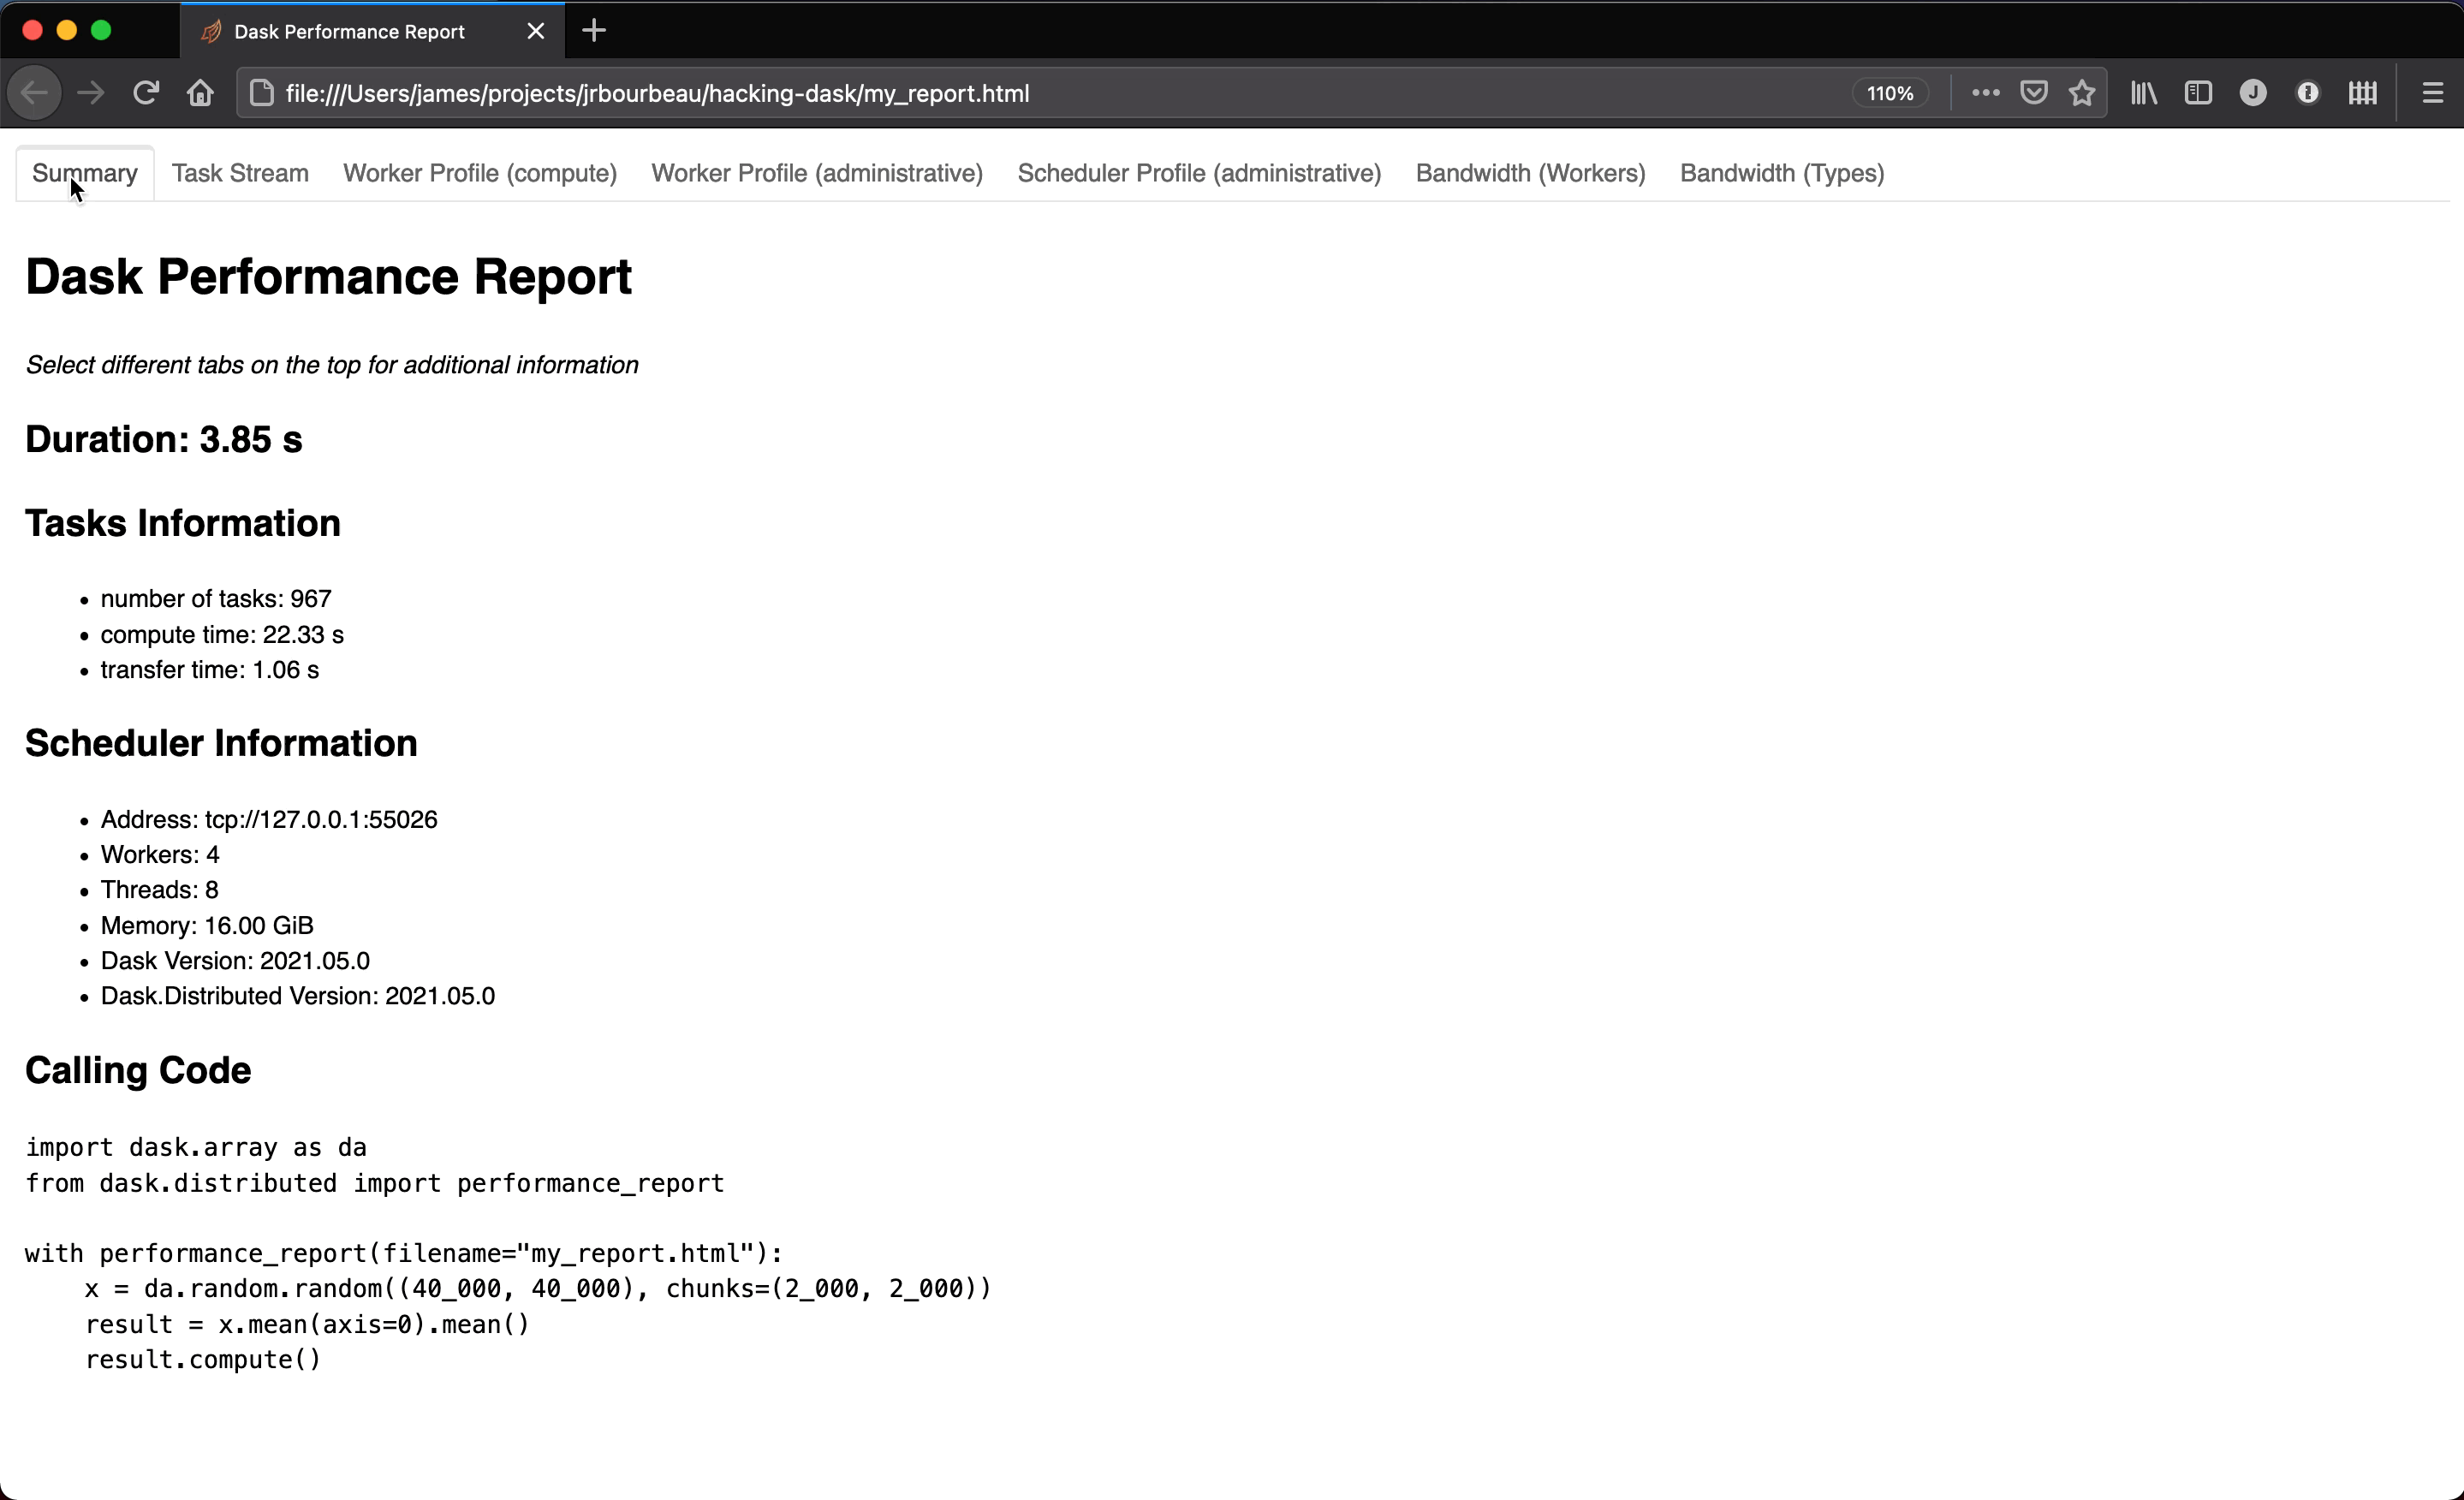
Fortunately, Dask has the ability to create performance reports which saves dashboard plots, information about your cluster, and the code that was used to generate the report to a static HTML file which you can refer back to later or share with colleagues. Having such an artifact is particularly valuable when benchmarking or profiling a computation or workflow.
How to create a performance report
Generating a performance report involves wrapping your normal Dask code in a
performance_report context manager:
import dask.array as da
from dask.distributed import Client, performance_report

# Create a local Dask cluster
client = Client()

# Generate a performance report from the code in this with block.
# A `my_report.html` file with the report will be created locally.
with performance_report(filename="my_report.html"):
    x = da.random.random((10_000, 10_000), chunks=(1_000, 1_000))
    result = (x + x.T).mean(axis=0).mean()
    result.compute()
This will create a report with information about your cluster during the time the code
inside the performance_report context block was running.
And that’s it! Go forth and use performance reports 🎉